
 +86 18721624519
Amortisationszeiten für verschiedene Arten von Photovoltaikprojekten
I. Was ist eine Amortisationszeit? Warum ist sie wichtig?
Die Amortisationszeit bezeichnet die Zeit, die ein Photovoltaikprojekt benötigt, um seine Anfangsinvestition durch den angesammelten Cashflow aus Energieeinsparungen, Stromverkäufen oder Subventionen wieder hereinzuholen. Die Formel lautet typischerweise:
Payback Period = Initial Investment Cost ÷ Annual Average Net Cash Flow (Energy Savings + Electricity Sales + Subsidies - Operational Costs)
Diese Kennzahl misst die Geschwindigkeit der Investitionsrendite. Je schneller die Amortisation, desto geringer das Risiko und desto attraktiver ist die Investition für das Kapital.
II . Verschiedene Arten von Photovoltaikprojekten und ihre typischen Amortisationszeiten
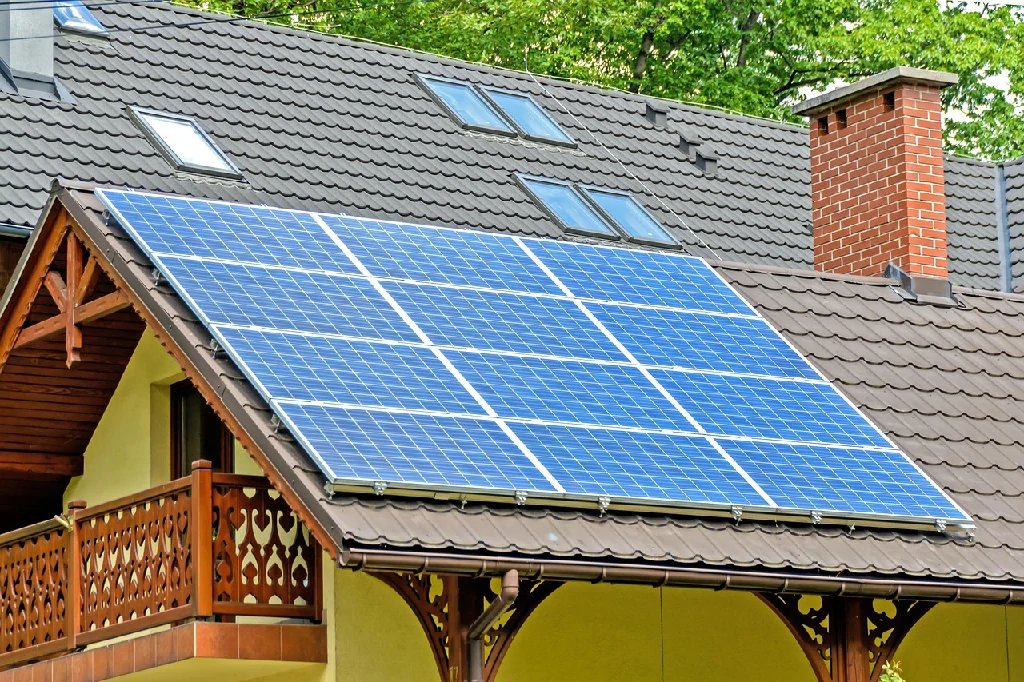
- PV-Anlagen auf Privatdächern
In residential settings in the United States, Europe, the Middle East, etc.: The average payback period is 6-10 years. In areas with high electricity prices, rapid electricity price increases, or tax/subsidy incentives, the payback period can be shorter.
In China: The annual return on investment is approximately 8-10%, with a typical payback period of 6-8 years.
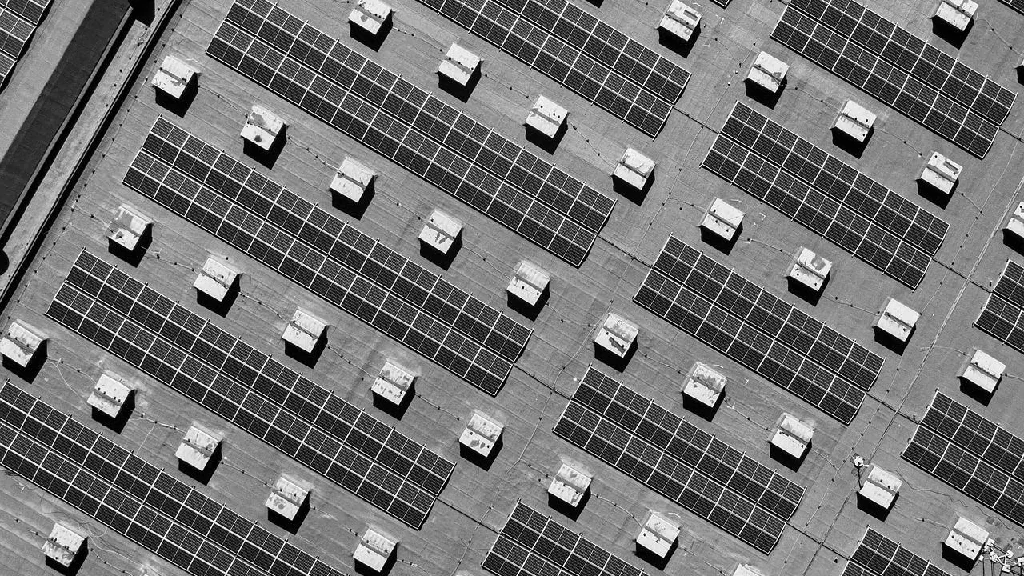
- Gewerbliche und industrielle PV-Dachanlagen
Globally, for business users, especially under peak electricity rates or tiered pricing, commercial projects can achieve annual returns of 10-15%, with typical payback periods of around 5 years.
In regions like California, business projects typically achieve payback in 3-5 years, while non-profit organisations may take slightly longer at 4-7 years.
- PV-Kraftwerke im Versorgungsmaßstab
Globally, mainstream utility-scale projects, especially in resource-rich countries (China, India, the United States, the Middle East, Africa, etc.), achieve annualised returns of 6-10%, with a typical payback period of 6-10 years.
In regions with poorer solar resources and reduced subsidies, such as the United Kingdom, utility-scale projects may have extended payback periods of 10-12 years.
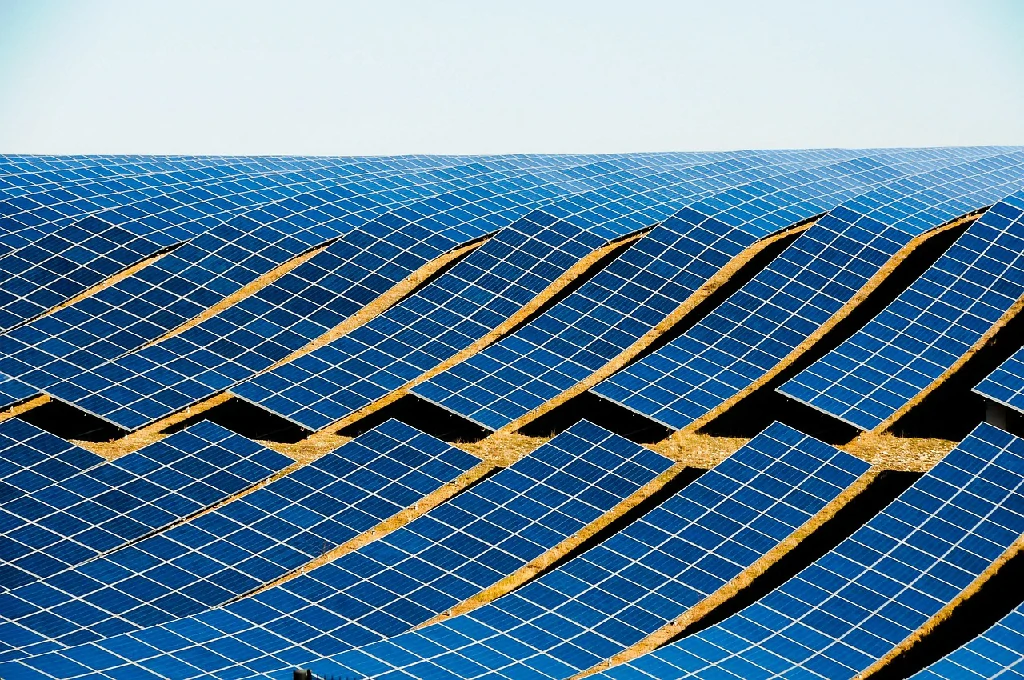
- Gemeinschaft Solar
Community-shared solar projects allow multiple parties to invest and share profits, with payback periods varying significantly, typically ranging from 6-20 years. Local electricity prices, subsidies, and participation agreements all influence this period.
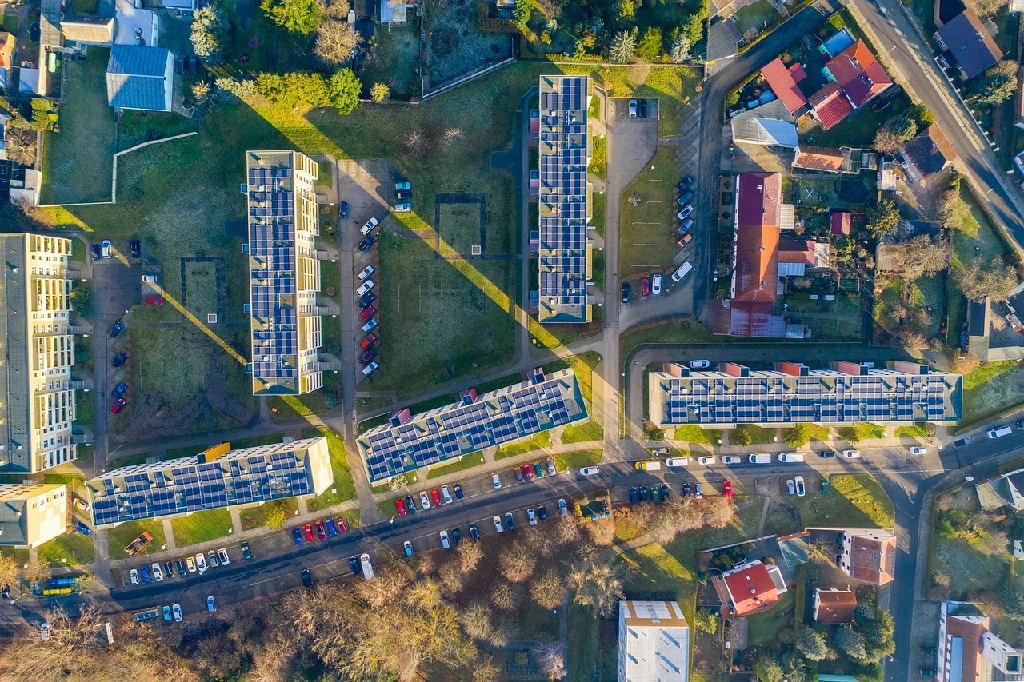
- Agrivoltaik
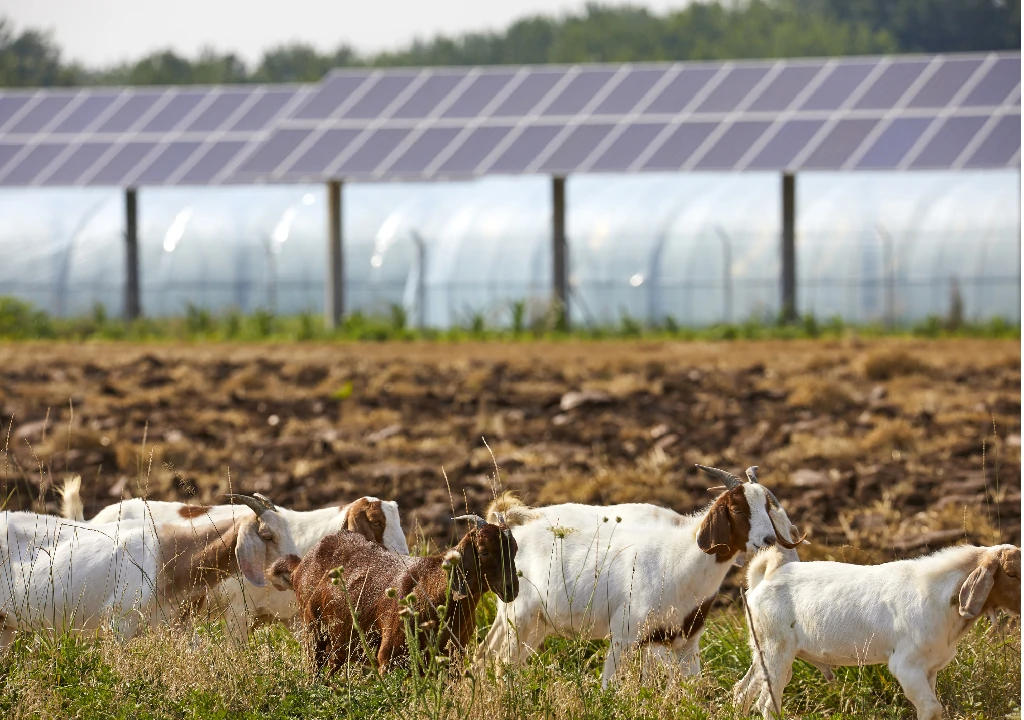
Systems combining agriculture and solar power, enabling farmers to benefit from both crop cultivation and electricity generation. The payback period is generally shorter, typically 4-8 years, with some cases even faster.
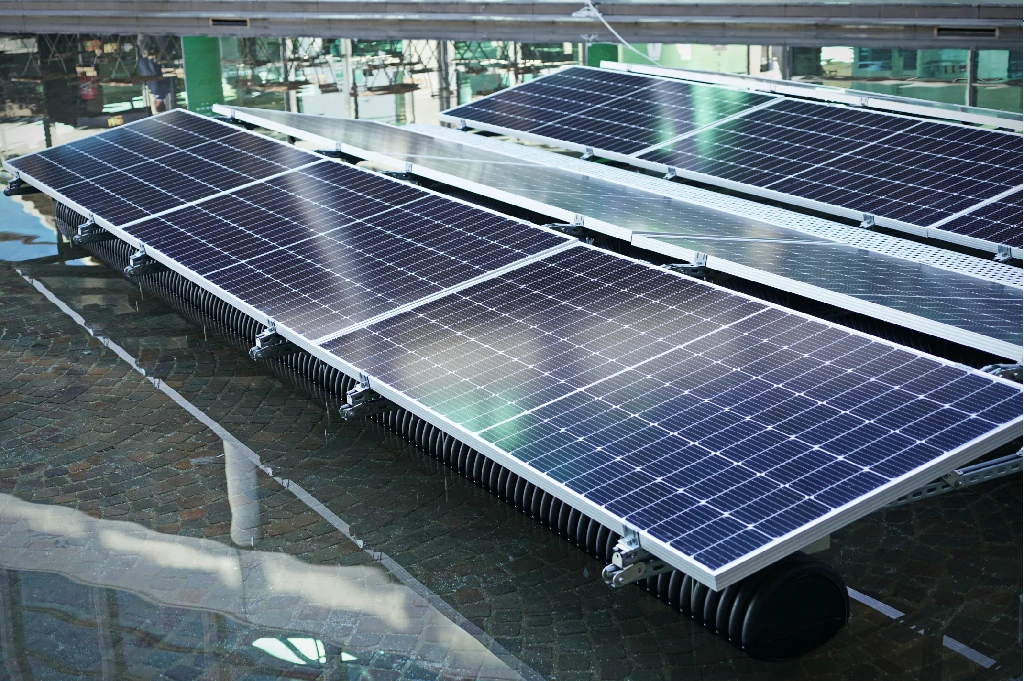
- Schwimmende Photovoltaik
Auf Wasserflächen installierte PV-Anlagen profitieren von Kühleffekten und geringeren Grundstückskosten, was zu einer Energie-Amortisationszeit von ca. 1.3 Jahren führt (aus der Perspektive der Energieinvestition, nicht aus der monetären Perspektive). Die tatsächliche wirtschaftliche Amortisationszeit beträgt typischerweise 3 bis 5 Jahre.
III . Schlüsselfaktoren, die die Amortisationszeit beeinflussen
- Geografische und solare Bedingungen
Regionen mit reichlich Solarressourcen (wie der Nahe Osten, Südasien, Afrika und Südeuropa) weisen eine höhere jährliche Stromerzeugung auf, was zu kürzeren Amortisationszeiten führt. In Nordeuropa sind die Amortisationszeiten länger.
- Strompreise und Förderpolitik
In Regionen mit hohen Strompreisen und üppigen Subventionen (wie Einspeisetarifen und Steuergutschriften) amortisiert sich die Investition schneller; in Ländern mit geringeren Subventionen und niedrigeren Strompreisen erfolgt die Amortisierung langsamer.
- Systemgröße und Projekttyp
Small-scale distributed systems offer flexible and rapid returns; however, large-scale centralised projects, despite higher total costs, have lower cost per kilowatt-hour and stable revenue streams, enabling the overall payback period to be controlled within 6-10 years.
- Ob mit Energiespeichern (Photovoltaik-Speicher) ausgestattet
Photovoltaic-storage systems increase self-consumption rates but raise initial investment costs. For example, in China's residential photovoltaic-storage cases, the payback period is approximately 6 years; factors such as technological costs and local electricity price tier structures also influence the cycle.
- Betriebs- und Wartungskosten und Systemverschlechterung
As panel components age and operations and maintenance costs increase, actual cash flow is slightly lower than theoretical models. Therefore, it is recommended to reserve a 10-15% depreciation margin.
IV . Vergleichstabelle typischer Typen aus globaler Perspektive
| Projekttyp | Jährlicher Ertrag (geschätzt) | Typische Amortisationszeit (Jahre) | Beispiele für regionale Einstellungen |
| Dezentrale Photovoltaik für Privathaushalte | ~8–10 % | 6-8 / 6-10 | China, die Vereinigten Staaten, das Vereinigte Königreich, der Nahe Osten usw. |
| Kommerzielle/industrielle dezentrale PV | ~10–15 % | ~5 | Firmendächer, Einkaufszentren, Krankenhäuser usw. |
| Freiflächen-PV im Versorgungsmaßstab | ~6–10 % | 6-10 / 10-12 | China, Indien, das Vereinigte Königreich, Afrika, die Vereinigten Staaten usw. |
| Gemeinschafts-PV | Variable | 6-20 | Nordamerika, Europa, Entwicklungsländer usw. |
| Agrivoltaik | Gleichzeitiges Einkommen aus Landwirtschaft und Stromerzeugung | 4-8 | China, Japan, Europa usw. Projekte zur Integration von Solarenergie in die Landwirtschaft |
| Schwimmende Photovoltaik | Hohe Effizienz, flächensparend, platzsparend | Energy payback ~1.3 years; economic payback approx. 3-5 | Länder mit reichlich Seen-, Stausee- und Wasseroberflächenressourcen |
Letzte Aktualisierung: 16.04.2024